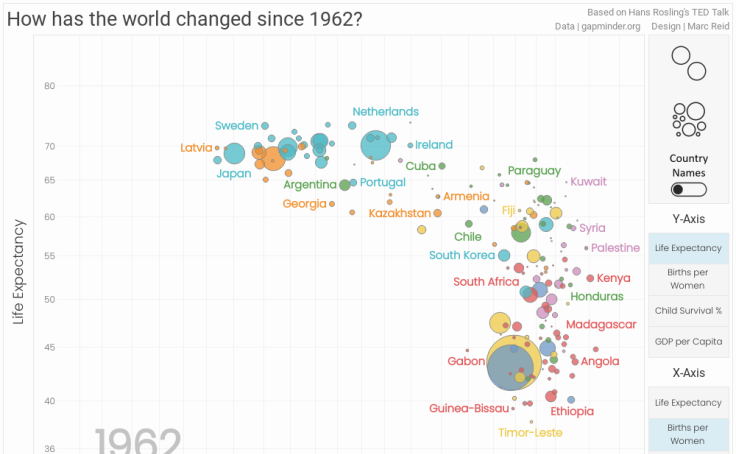
Inspired by Hans Rosling’s 2006 TED Talk (https://bit.ly/3c5LPUa). Animated Transitions blog: https://datavis.blog/2020/01/21/tableau-animated-transitions/ #VizAnimations #AnimatedTransitions
Original Link: https://public.tableau.com/app/profile/marc.reid/viz/Howhastheworldchangedsince1962/WorldIndicators
In 2006, Hans Rosling presented a TED talk in which he shared the story of an improving world by means of a series of scatter plots and other charts that helped viewers more easily see and understand the data being presented by using animated transitions. The presentation captivated the audience and the recording has gone on to be viewed more than 14 million times.


